Logistics Market Update – March 2026
For the better part of last year, supply chains have been waiting for clarity. Businesses were navigating a fog of uncertainty surrounding tariffs, geopolitical risks, and domestic policy changes. Tariffs have been litigated, debated and appealed creating a great deal of confusion for manufacturers and distributors. Ambiguity itself, not just the policy of tariffs, is a primary driver of inventory destocking.1 That fog of confusion began to lift recently after a pivotal ruling by the Supreme Court of the United States clarified the legality of tariff policies that had been challenged in lower courts. With the legal uncertainty now clear, many manufacturers are moving forward with increased production plans and rebuilding inventory levels.
Recent economic data suggests that this shift is already underway. The latest manufacturing survey from the Institute for Supply Management (ISM) reported that the U.S. manufacturing Purchasing Managers Index (PMI) registered 52.4 in February, marking two consecutive months of expansion after an extended contractionary period.2 Any reading above 50 indicates growth in the sector.
The February 2026 ISM Manufacturing Report confirms what logistics professionals have been observing on the ground: manufacturing is in a genuine growth cycle.
| METRIC | Status | Trend |
|---|---|---|
| Overall PMI | 52.4% | 2nd consecutive month of expansion |
| New Orders | Growth | Sustained growth which is a leading indicator of future freight demand |
| Production | Growth | 4th consecutive month of expansion |
| Deliveries (Supplier) | Growth | Rate of growth is increasing |
| Inventories | Contracting | Rate of contraction is decelerating |
| Imports | Surged to Growth | Previously unchanged; now firmly in expansionary status |
| Exports | Growing | Backlog of orders also growing |
| Prices paid | 70.5 | 17th consecutive month of price increases; rate of pricing growth extremely elevated |
The headline PMI of 52.4% is the second consecutive month above 50, the demarcation line between expansion and contraction, following nearly two years of intermittent softness (Spence, 2026). Production has grown for four consecutive months, but the more telling signal for logistics planning is the condition of new orders, which remain in expansion. New orders are the leading indicator of future freight demand; when orders grow today, trucks and containers are needed tomorrow. Inventory dynamics are particularly noteworthy. The Inventories Index remains in contraction at 48.8, but the rate of contraction is slowing, suggesting that companies are gradually rebuilding stock levels following a prolonged destocking cycle.
However, two indicators stand out as warning signals for supply chain inflation. First, the Prices Index jumped to 70.5, marking 17 consecutive months of rising input costs and one of the strongest readings in nearly four years.3 And second, imports surged from neutral to growth, registering 54.9, the highest level since early 2022.
This imports surge is particularly notable. Imports moved from flat (unchanged) directly into growth mode in a single reporting period. This is consistent with the post-tariff-clarity thesis: importers who had been sitting on the sidelines are now actively front-running inventory builds. With backlog of orders also growing, the demand signals across the ISM report are uniformly pointing toward higher freight volumes in the near term.
Logistics Manager Index: Market Acceleration
If the ISM Manufacturing Report is the demand signal, the Logistics Managers Index (LMI) is the operational readout of how the supply chain is responding. The February 2026 LMI tells a story of a freight market that has definitively turned a corner, and is doing so at an accelerating pace.
The overall LMI reading came in at 61.5, a robust score indicating broad-based expansion. But the directional detail within the sub-indices is where the story becomes urgent for shippers, and something to pay attention to:
| Sub-Index | Status | Direction |
|---|---|---|
| Warehousing Utilization | Growing | ↑ Increasing at an increasing rate |
| Warehousing Capacity | No Movement | → Flat |
| Transportation Utilization | 61.9 | ↑ Increasing at an increasing rate |
| Transportation Capacity | 41.0 (Sharp contraction) | ↓ Fastest contraction since Nov. 2021 |
| Transportation Prices | 76.7 | ↑ Increasing at an increasing rate |
| Inventory Levels | No Movement | → Fairly consistent (+0.5) |
The February LMI report states directly:
“There was more evidence in February that the long-awaited freight market comeback is in full-swing. Transportation Capacity continues to tighten (-6.0) reading in at 41.0 which is the fastest rate of contraction since November 2021 at the height of the covid shipping boom. This tightness is uniform across supply chains, but it is especially driven by larger firms, who’s reported 32.6 reading is the fastest rate of contraction in five years, and speaks to the increased asset utilization necessary to drive inventory turnover.”
When Transportation Capacity contracts, rates rise. This is not speculation, it is the fundamental economics of the freight market.4 The year-over-year Transportation Capacity reading plunged from 55.1 to 41.0, a collapse of 14 index points that underscores the speed at which available capacity is being absorbed. The largest firms—those with the deepest asset bases—are contracting capacity at the fastest rate in five years, signaling that utilization is being driven to extremes.
The LMI report further notes on pricing:
“Transportation Prices are also expanding at a pace not seen in four years, coming in hot (+5.2) at 76.7 which is the highest level for that metric since March of 2022. This is driven most strongly by Upstream firms, who reported Transportation Price expansion of 79.7, statistically significantly higher than the still robust 68.3 reported by Downstream firms.”
A Transportation Prices reading of 76.7 means the freight rate environment is accelerating, not just elevated. Upstream firms, those closest to raw materials and primary manufacturing, are experiencing the sharpest price increases, at 79.7, compared to downstream distribution firms at 68.3.5 This upstream-to-downstream transmission typically forecasts broader rate increases within one to two quarters as inflationary freight costs migrate through the supply chain.
Oil Price Volatility: The Fuel Cost Wild Card
On March 9, 2026, oil futures reached an intraday high of $119.53 per barrel before retracing sharply to approximately $99, settling near $101.62 at the time of authorship. This intraday range of nearly $20 per barrel in a single session reflects the extreme uncertainty now embedded in global energy markets as a consequence of the Iranian conflict and the closure of the Strait of Hormuz.
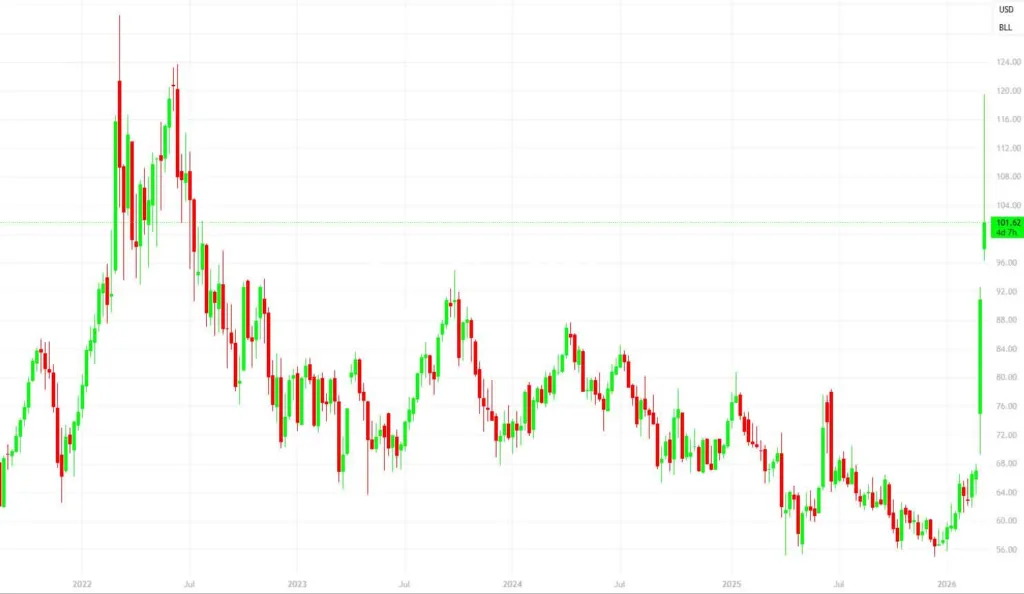
It is important to note how TLI structures its contracts in relation to fuel. TLI’s custom contract service is designed so that fuel is not a profit center for motor carriers, rather, fuel surcharge mechanisms are calibrated to cover carriers’ actual costs without requiring them to hedge exposure independently. This approach means carriers operating under TLI contracts can absorb fuel volatility within the framework rather than passing unexpected spikes directly to the shipper, and they do not need to carry the base rate artificially high to self-insure against fuel risk. The current environment, however, tests the upper bounds of any fuel recovery mechanism. At $101+/barrel, fuel represents a materially higher cost baseline than most Q4 2025 contract negotiations assumed. This surge in fuel has resulted in an increase to diesel pricing:
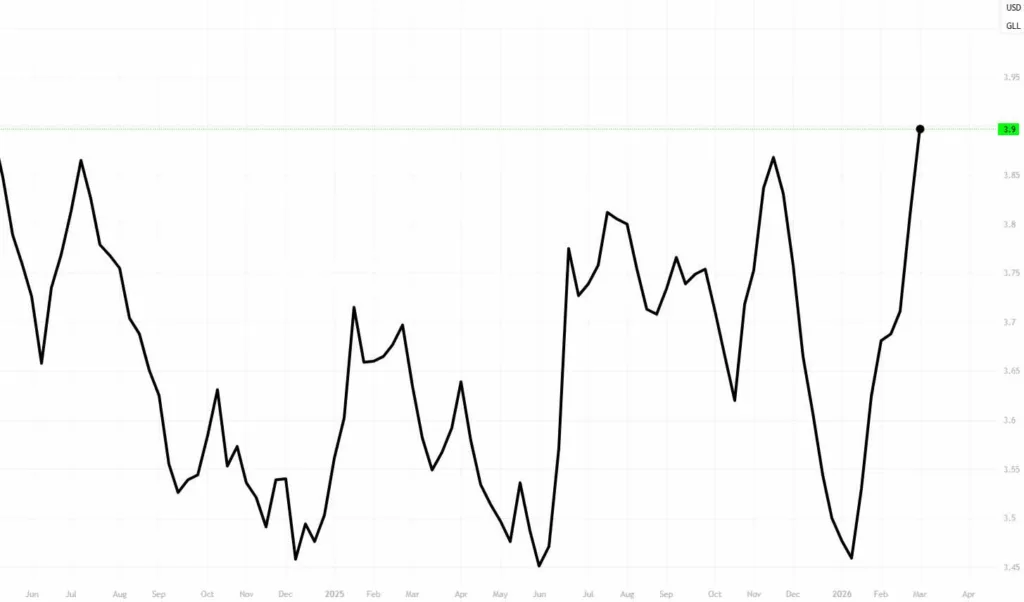
Academic research on the relationship between diesel prices and truckload spot rates consistently demonstrates a lagged but strong positive correlation, with rate responses typically manifesting within 30 to 60 days of sustained energy price elevation.6 Shippers should anticipate upward fuel surcharge adjustments across modes if the Iran war continues on over a great deal of time. Rates will remain elevated if oil stabilizes consistently above the $100/barrel threshold.
The Iran Conflict and Global Supply Chain Disruption
Strait of Hormuz: A Chokepoint Under Siege
Iran’s closure of the Strait of Hormuz has introduced a systemic shock to global trade flows that extends well beyond the energy sector. The Strait is one of the world’s most critical maritime chokepoints: approximately 21% of global petroleum liquids transit this passage, as do significant volumes of LNG, petrochemicals, and containerized cargo originating from Gulf states including the UAE, Qatar, Kuwait, Saudi Arabia, and Iraq.
The closure is not merely a Middle Eastern concern—it is a global logistics event. The U.S. Energy Information Administration has previously identified the Strait of Hormuz as the world’s most important oil chokepoint; any sustained disruption forces rerouting through the Cape of Good Hope or other alternative passages, adding 7 to 14 days of transit time per voyage depending on origin and destination, driving vessel utilization higher and consuming available capacity across global shipping networks.
Impact on Global Ocean Freight Capacity
The operational effects of the conflict are already materializing in spot rate data:
- China → North America West Coast: up 10% week-over-week
- South East Asia → Europe: up 58% week-over-week
- Gulf-bound cargo is experiencing active carrier diversions, with disruption currently concentrated in Gulf lanes while other routes operate normally, though this equilibrium is fragile
CMA CGM, one of the world’s largest ocean carriers, has already announced emergency fuel surcharges of $75–$150 per TEU across all lanes, effective March 23, 2026. This is not a lane-specific adjustment, it is a network-wide surcharge reflecting the systemic elevation of operating costs caused by the conflict. Other major carriers are expected to follow with similar mechanisms.7
Beyond what is already visible in rate data, the conflict carries several additional vectors of negative impact on global logistics capacity:
- Vessel insurance premiums (war risk coverage) have spiked dramatically for routes through or near the Persian Gulf. Premiums that were negligible are now representing hundreds of thousands of dollars per voyage, further elevating the all-in cost of ocean freight.
- Petrochemical and LNG supply disruptions from Gulf-region producers are compounding domestic manufacturing input costs.
- Port congestion risk is rising at alternative routing hubs. As carriers divert away from Gulf ports, transshipment hubs such as Singapore, Port Klang, Colombo, and Algeciras face absorbing diverted volume.
- Cargo insurance rates for shipments involving Gulf origin or destination points have elevated materially, adding a non-freight cost layer that shippers must account for in landed cost calculations.
- Energy price transmission to air freight is also underway: jet fuel prices tied to crude have increased operating costs for air cargo carriers, with surcharges being introduced or expanded across trans-Pacific and Europe-Asia routes.
Historical analogues, the 2021 Suez Canal blockage, the 2019 Gulf of Oman tanker attacks, and the Houthi-driven Red Sea disruptions of 2024, all demonstrated that even temporary maritime disruptions can produce multi-quarter rate effects as capacity adjustments take time to resolve and shipper behavior (e.g., inventory pre-positioning) sustains elevated demand.
Domestic Capacity Tightening: Regulatory Compression
English Language Proficiency Enforcement
The FMCSA’s enforcement of English Language Proficiency (ELP) requirements for commercial motor vehicle operators—reinstated and actively enforced under current DOT policy—has resulted in the removal of a non-trivial number of drivers from active service. The ELP rule requires that CMV drivers operating in interstate commerce be able to read and understand highway signs in English, respond to official inquiries, and complete required paperwork. Enforcement actions have disproportionately affected drivers operating on behalf of carriers utilizing non-domiciled CDL holders, and have contributed to carrier capacity reductions that show up directly in the LMI data.
FMCSA Non-Domiciled CDL Final Rule: Effective March 16, 2026
Effective March 16, 2026, the FMCSA’s final CDL rule (91 FR 7044) titled “Restoring Integrity to the Issuance of Non-Domiciled Commercial Drivers Licenses” fundamentally restructures eligibility for commercial driving credentials among foreign nationals. Under the new rule:
- Non-domiciled CDLs and CLPs are restricted exclusively to foreign nationals holding H-2A (Temporary Agricultural Workers), H-2B (Temporary Non-Agricultural Workers), or E-2 (Treaty Investors) visa status.
- DACA recipients, refugees, asylees, individuals with general Employment Authorization Documents (EADs), and all other immigration categories are explicitly excluded from non-domiciled CDL eligibility.
- States that cannot comply by March 16, 2026 are required to immediately pause issuance of non-domiciled CLPs and CDLs until compliance is achieved.
- The FMCSA strongly encourages states to audit and revoke all unexpired non-domiciled CDLs and CLPs that were not issued in compliance with the regulations in effect at the time of issuance.
- Maximum CDL validity is capped at one year or the applicant’s I-94 Admit Until Date, whichever is sooner, eliminating the long-term credentials previously issued under more permissive guidance.
- All renewals, reinstatements, upgrades, and transfers must comply with the new standards, requiring in-person SAVE system verification of lawful immigration status.
The capacity implications of this rule are significant.8 A portion of the active CMV driver pool operating under non-domiciled credentials in categories no longer eligible under the new framework will be removed from service. Carriers who have relied on this driver pool, particularly in agricultural, construction, and regional distribution sectors, face an immediate need to replace drivers or reduce available capacity. In my view, the LMI’s Transportation Capacity contraction to 41.0 is, in part, a forward reflection of this supply compression.
USPS: Strengthening Contracted Trucking Provider Requirements
In January 2026, the United States Postal Service announced it would phase out use of non-domiciled CDL operators who have not been thoroughly vetted by the U.S. Postal Inspection Service.9 USPS moves approximately 55,000 loads by truck daily, nearly 2 billion miles per year, to serve over 170 million delivery addresses. The scale of this contracted trucking operation means that USPS’s vetting requirements effectively function as a market-level screening standard, and carriers serving USPS contracts who cannot meet the new criteria face scope reductions or termination of agreements.
This action, aligned with DOT’s regulatory direction, adds an institutional enforcement layer that accelerates the market impact of the FMCSA rule. When the nation’s largest single shipper by delivery count is actively auditing its contracted carrier compliance with non-domiciled CDL standards, the industry-wide effect on driver availability is compounded.
Key Takeaways
The convergence of all these moving parts, and their impact on transportation pricing is not isolated to the Iranian war alone, it is a synchronized tightening across every dimension of the freight market: demand, supply, energy, regulation, and geopolitics.
Summary of Market Pressures (March 2026)
| Factor | Current Signal | Rate Implication |
|---|---|---|
| Manufacturing Demand | ISM 52.4%; 2nd month expansion | ↑ Volume and truck demand |
| New Orders / Imports | Both growing; imports surged | ↑ Near-term freight demand rise |
| Domestic Truck Capacity | LMI 41.0; fastest contraction since ’21 | ↑ Rate pressure building |
| Transportation Prices | LMI 76.7; 4-year high | ↑ Already inflecting upward |
| Driver Pool | CDL rule effective Mar 16, ’26 | ↑ Supply-side compression |
| Fuel / Oil | $101.13/bbl; intraday high $119.53 | ↑ Fuel surcharge upward pressure |
| Iran / Strait of Hormuz | Closed; war risk surcharges active | ↑ Ocean freight elevated |
| Ocean Spot Rates | SE Asia–Europe +58% w/w | ↑ Intermodal / air pressure follows |
The window to secure stable contract pricing is beginning to narrow. With tariff clarity prompting many shippers to re-engage carrier relationships and an import surge underway, capacity across both ocean and domestic networks is being absorbed at an accelerated pace. At the same time, geopolitical risk in the Middle East is introducing additional cost pressures through fuel price volatility, surcharges, and insurance premiums. As a result, shippers should expect continued rate increases through at least Q2 2026. Acting now with TLI to secure contract capacity before the broader market fully reprices can help protect transportation budgets and provide greater predictability in landed cost models.
Launching a transportation RFP, with TLI’s supply chain tools, in the near term allows shippers to take advantage of current pricing levels before further upward pressure develops. TLI can quickly field a competitive RFP process, leveraging our carrier network to source reliable capacity and negotiate favorable contract terms across lanes and modes. This approach helps lock in dependable service while mitigating exposure to rising fuel costs, surcharge adjustments, and tightening equipment availability. For shippers anticipating higher volumes or preparing for continued inventory inflows, engaging TLI now ensures that transportation capacity is secured ahead of what may become a significantly more expensive market environment.
References & Citations
- Handley, K., & Limão, N. (2017). Policy Uncertainty, Trade and Welfare: Theory and Evidence for China and the United States. American Economic Review, 107(9), 2731–2783. doi:10.1257/aer.20141419. ↩︎
- Spence, S. (2026, February). ISM® Manufacturing PMI® report on business®. Institute for Supply Management. https://www.ismworld.org/globalassets/pub/research-and-surveys/rob/pmi/blud202602pmi.pdf ↩︎
- Ibid. ISM Prices Paid index methodology: readings above 50 indicate month-over-month price increases for manufacturing inputs; readings above 70 indicate rapid acceleration. ↩︎
- Rogers, D.S., Leuschner, R., & Choi, T.Y. (2022). Freight Market Dynamics and Capacity Utilization. Journal of Business Logistics, 43(1), 44–62. doi:10.1111/jbl.12295 ↩︎
- Logistics Managers Index Research Team. (2026). Logistics Managers Index Report — February 2026. Arizona State University, Colorado State University, University of Nevada Reno, and Rutgers University. https://www.the-lmi.com/february-2026-logistics-managers-index.html ↩︎
- Hummels, D., & Schaur, G. (2013). Time as a Trade Barrier. American Economic Review, 103(7), 2935–2959. doi:10.1257/aer.103.7.2935. See also: Sims, E. et al. (2020). Fuel Cost Pass-Through in Truckload Freight Markets. Transportation Research Part E, 141, 102016. ↩︎
- Saratsopoulou, A. (2026, March 7). CMA CGM introduces emergency fuel surcharge amid Middle East tensions. Container News.
https://container-news.com/cma-cgm-introduces-emergency-fuel-surcharge-amid-middle-east-tensions/ ↩︎ - Federal Motor Carrier Safety Administration. (2026). Non-Domiciled CDL 2026 Final Rule FAQs (91 FR 7044). Effective March 16, 2026. Washington, DC: FMCSA. Retrieved from https://www.fmcsa.dot.gov/regulations/non-domiciled-cdl-2026-final-rule-faqs ↩︎
- United States Postal Service. (2026, January 5). U.S. Postal Service Is Strengthening Requirements For Contracted Trucking Providers. Washington, DC: USPS Newsroom. Retrieved from https://about.usps.com/newsroom/national-releases/2026/0105-usps-is-strengthening-requirements-for-contracted-trucking-providers.htm ↩︎