
Truck freight rates moved sharply higher through the spring and into early summer of 2026, and the data now points to a specific cause, demand growth and capacity contraction arrived at the same time. That combination is unusual. Most freight cycles are driven primarily by one side of the market or the other. This one is different, and the practical result for shippers is a rate environment that is unlikely to soften quickly.
Spot rates rose 31.29% year-over-year in April and May 2026, while contract rates rose 9% over the same stretch, according to the U.S. Bank Freight Payment Index (U.S. Bank, as reported in Fitzgerald, 2026). Those are not small moves higher. They reflect a market where available truck capacity has not kept pace with freight volume, and where a series of federal regulatory changes is actively removing drivers and carriers from the available pool at the same time demand from shippers is picking up.
Executive Summary
- The Logistics Managers’ Index registered 71.1 in June 2026, with transportation utilization, warehousing utilization, and inventory levels all expanding at an accelerating pace (Logistics Managers’ Index, 2026).
- DAT reports load postings (demand) up 62.2% year-over-year while truck postings (supply) are down 12% year-over-year, pushing van rates up 29.4%, reefer rates up 21%, and flatbed rates up 35.8% (DAT Freight & Analytics, 2026).
- Spot truckload rates are up 31.29% year-over-year and contract rates are up 9%, per the U.S. Bank Freight Payment Index (Fitzgerald, 2026).
- ISM’s Manufacturing PMI held at 53.3 in June, with new orders above 50 for six consecutive months, supporting continued freight demand (Institute for Supply Management ISM, 2026).
- Transportation services PPI rose 16.0% year-over-year for truck specifically, far outpacing the 5.0% increase across all services (U.S. Bureau of Transportation Statistics BTS, 2026).
- Diesel prices, currently averaging $4.796 per gallon, are elevated and moving in the opposite direction of crude oil’s typical volatility (U.S. Energy Information Administration EIA, 2026).
- A stack of new federal rules, covering drug and alcohol clearinghouse verification, non-domiciled CDLs, English-language proficiency enforcement, and proposed EPA emissions changes, is expected to tighten carrier capacity further into the back half of 2026.
Shipping Demand Recovery Colliding With a Shrinking Carrier Pool
Freight rate cycles typically follow one of two patterns. Either demand grows faster than supply can be added, or supply gets pulled out of the market faster than demand can absorb it. The current cycle is showing both patterns simultaneously, which is why the rate response has been so pronounced.
Demand Side
On the demand side, ISM’s Manufacturing PMI registered 53.3 in June 2026, marking continued expansion in the sector that generates a large share of truckload freight (ISM, 2026). New orders have now expanded for six consecutive months, which is a leading indicator because new orders precede production, and production precedes shipments. The Prices Index within the same PMI report came in at 73, reflecting continued input-cost inflation even as the pace of price increases has begun to cool from its recent peak (ISM, 2026).
Supply Side
On the supply side, DAT’s load-to-truck ratio data shows just how lopsided the balance has become. Load postings are up 62.2% year-over-year, while truck postings — the supply-side proxy — are down 12% year-over-year (DAT, 2026). That combination pushed the van load-to-truck ratio up 64% and the flatbed ratio up 152.1% (DAT, 2026). SONAR data has also shown national average dry van rates recently pushing past $4 per mile for the first time, though as with any national average, that figure masks significant lane-level variation; a national average is a poor proxy for a lane running through the upper Midwest versus one running through the Southeast.
Table 1: DAT Rate and Capacity Indicators (Year-over-Year, June 2026)
| Metric | Change (YoY) |
|---|---|
| Load postings (demand) | +62.2% |
| Truck postings (supply) | (12.0%) |
| Van rates | +29.4% |
| Reefer rates | +21.0% |
| Flatbed rates | +35.8% |
| Van load-to-truck ratio | +64.0% |
| Flatbed load-to-truck ratio | +152.1% |
Source: DAT Freight & Analytics, DAT Trendlines (2026).
The Logistics Managers’ Index Confirms the Trend From the Inventory Side
The Logistics Managers’ Index (LMI) reached 71.1 in June 2026, one of its strongest readings on record, driven largely by inventory levels expanding at an accelerating rate, up 5.7 points to 60.5 (Logistics Managers’ Index, 2026). Warehousing utilization and warehousing prices are also expanding at an increasing rate, which is consistent with shippers building inventory ahead of anticipated cost increases rather than running lean.
Transportation pricing within the LMI eased slightly from May’s reading of 96.0, which the report’s authors described as the fastest rate of expansion ever recorded for any metric in the index’s history, to 92.4 in June (Logistics Managers’ Index, 2026). That is still a rapid pace of increase; it is only decelerating relative to an extraordinary two-month run. Transportation capacity, meanwhile, continued compressing, down another 0.9 points to a reading of 30.8, and the report’s respondents expect capacity to remain tight through the summer, with utilization and prices both forecast to keep accelerating (Logistics Managers’ Index, 2026). The report attributes the initial price acceleration to oil costs, but notes rates have stayed elevated because of the ongoing shortage of available transportation capacity, not fuel alone (Logistics Managers’ Index, 2026). Rail intermodal volume has responded to the tight truck market as well, with the number of containers routed by rail each week up roughly 6%, consistent with some freight shifting modes to manage cost and capacity constraints.
Inflation Data: Headline Relief, Core and Energy Still Elevated
The Consumer Price Index fell 0.4% in June on a monthly basis, but that headline decline obscures a more complicated underlying picture (U.S. Bureau of Labor Statistics [BLS], 2026). Core CPI, all items less food and energy, was up 2.6% year-over-year, and the energy component remains sharply elevated on a 12-month basis even after the monthly pullback (BLS, 2026). For freight buyers, this matters because transportation costs are more closely tied to energy and input-cost trends than to the broad headline CPI figure that consumer-facing coverage tends to emphasize.
Producer Prices Show the Cost Pressure Is Concentrated in Trucking
The Bureau of Transportation Statistics’ Transportation Producer Price Index shows freight transportation and equipment prices up 2.3% year-over-year as of June 2026, which raises costs directly for carriers purchasing trucks, trailers, and related equipment (BTS, 2026). More striking is the breakdown of the transportation services PPI by mode, which shows truck costs rising far faster than every other mode tracked.
Table 2: Transportation Services PPI by Mode (June 2025–June 2026)
| Mode of Transportation | Change (YoY) |
|---|---|
| Truck | +16.0% |
| Water | +9.9% |
| Air | +9.1% |
| Rail | +0.7% |
| Arrangement of freight & cargo | +0.6% |
| All services (transportation & non-transportation) | +5.0% |
Source: U.S. Bureau of Transportation Statistics, Transportation Producer Price Index (2026).
The gap between truck’s 16.0% increase and rail’s 0.7% increase helps explain why some shippers are converting truckload freight to intermodal where lane and service requirements allow it, a shift consistent with the roughly 6% increase reported in weekly rail container volume noted above.
Diesel Is Moving Slower Than Oil, But It Is Not Moving Straight Down
Diesel prices rose week-over-week and now average $4.796 per gallon nationally, according to the U.S. Energy Information Administration (EIA, 2026). Diesel tends to lag crude oil price movements and does not track crude’s day-to-day volatility as closely; that means a drop in crude prices does not translate immediately into lower pump prices for carriers. Since trucking runs on diesel rather than crude directly, this lag matters for how quickly fuel surcharges and line-haul costs can adjust in either direction.
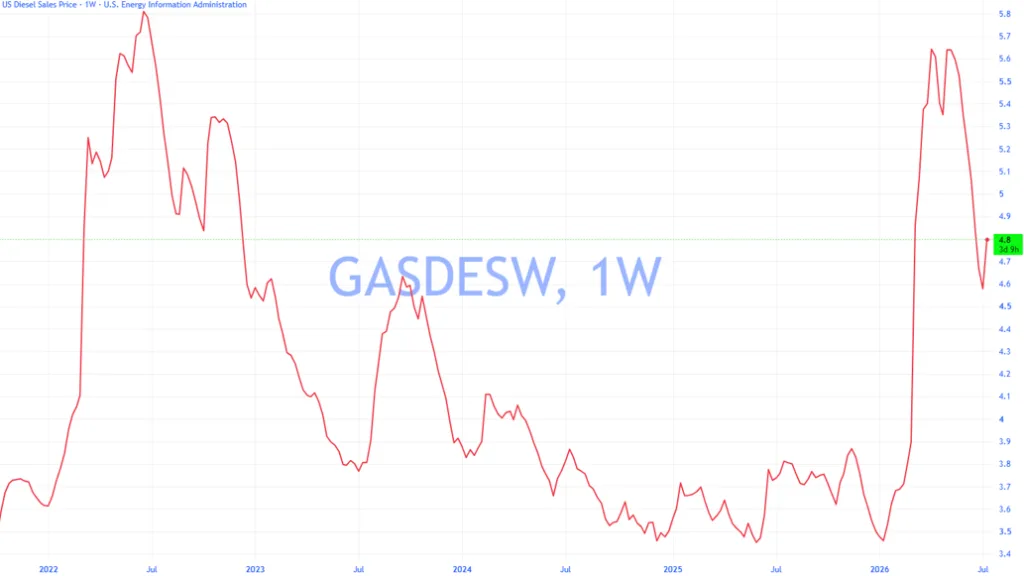
Source: Diesel is now average $4.796/gallon nationally, according to the U.S. Energy Information Administration (EIA, 2026).
Comparing U.S. Diesel and Crude Oil Price Volatility Over Time
Diesel is refined from crude, but the price carriers pay at the pump also reflects refining capacity, crack spreads, seasonal demand, and supply disruptions specific to diesel and distillates. These factors can push diesel up faster than crude, and keep it elevated even after crude has dropped lower. While they may be correlated they are not moving together in identical percentages. trucking, rail, shipping, and agriculture all price their fuel costs directly off diesel, not crude. So when a headline announces that “oil prices dropped,” it’s easy to assume fuel costs eased in lockstep, but as this chart below shows, diesel can lag the decline, or not fall nearly as much in percentage terms. For anyone managing freight budgets, fuel surcharges, or logistics costs, watching diesel prices directly, rather than inferring them from crude oil headlines, is the more reliable approach.
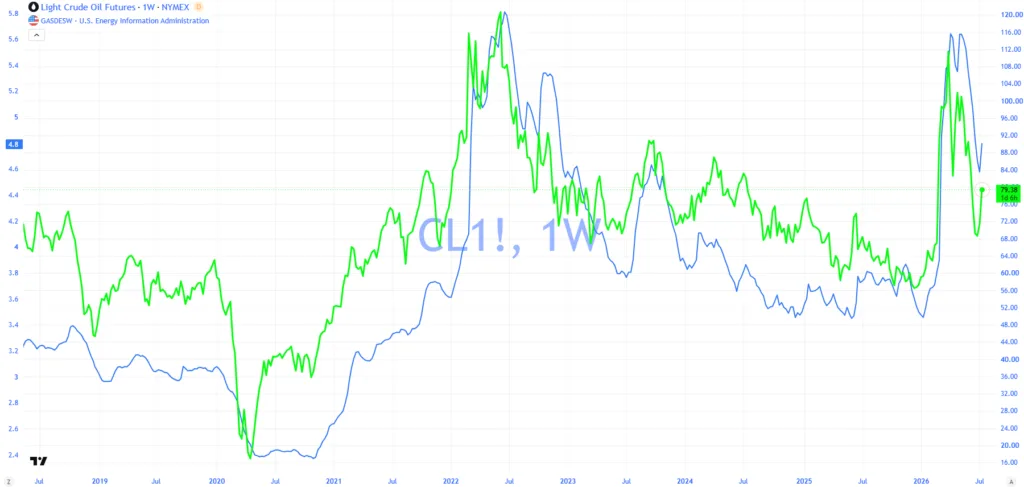
The two lines, diesel (blue) and oil futures (green) trend together because diesel is made from crude oil, so when oil gets more expensive, diesel usually does too. But they don’t move in perfect step, and the chart shows several examples of why. In 2020, both prices crashed together as COVID lockdowns wiped out fuel demand almost overnight. In 2021 and 2022, oil prices shot up first, and diesel took a bit longer to catch up. Then, even after oil started coming back down in late 2022, diesel stayed expensive. That happened because several U.S. refineries closed for good during COVID, leaving less capacity to turn crude into diesel. With fewer refineries running, refiners could charge more for the finished product, so diesel prices stayed high even as their oil costs dropped. From 2023 to 2025, both prices trended down and diesel eased slightly as refining capacity recovered.
What is meaningful now is the unanticipated conflict breaking out in the Middle East. Oil started the year around $60 a barrel, but following the war in Iran on February 28, Iran shut down the Strait of Hormuz which i a critical shipping route for global oil. That sent crude prices surging to $118 a barrel by the end of the first quarter, the fastest jump on record. Diesel spiked even harder than oil in percentage terms, largely because Russia (normally a major diesel exporter) stopped selling diesel abroad after Ukrainian drone attacks damaged its refineries, forcing buyers around the world to turn to U.S. diesel supplies instead.
Regulation Is the Wild Card for Capacity Through the Rest of 2026
Several regulatory changes are converging to constrain carrier and driver supply further, independent of freight demand:
- Drug and Alcohol Clearinghouse ID verification. FMCSA has added new identity-verification requirements for the Drug and Alcohol Clearinghouse database, adding friction to driver qualification and onboarding processes (The Trucker, 2026).
- MOTUS system issues. Ongoing technical problems with the MOTUS system have slowed new carrier onboarding, and while critical functions are expected to be fixed gradually through 2026, many fleets are still facing lengthy customer service delays to update account information (Landline Media, 2026).
- Proposed EPA NOx rule changes. The EPA’s proposed amendments to heavy-duty NOx standards would roll back warranty extension requirements and remove diesel exhaust fluid (DEF) derates, potentially easing some of the roughly $10,000 per-truck cost increase that had been projected for Model Year 2027 diesel power units under the prior standard.
- Truck parking funding. DOT announced $62 million in BUILD grant funding for truck parking projects in Kentucky, Wyoming, Louisiana, Mississippi, and Illinois — a longer-term capacity support measure rather than an immediate offset (FleetOwner, 2026).
Non-domiciled CDL final rule. FMCSA’s final rule narrows non-domiciled commercial driver’s license eligibility to specific employment-based nonimmigrant classifications: H-2A, H-2B, and E-2, removing other previously eligible categories from the qualified driver pool (FMCSA, 2026). States including California have already begun canceling licenses that fall outside the new eligibility criteria (California DMV, 2026). - English-language proficiency enforcement. The Department of Labor has reinforced existing English-proficiency requirements under 49 CFR § 391.11(b)(2) for commercial drivers, adding another qualification hurdle during a period of tight driver supply (U.S. Department of Labor, 2026).
- Independent contractor rule. DOL has begun a new rulemaking process to redefine independent contractor status under the Fair Labor Standards Act, an interpretation that will affect how many owner-operators are classified relative to fleets (FleetOwner, 2026).
- Rhode Island truck-only tolls. Rhode Island is preparing to relaunch truck-only tolling, targeting operational status in the first quarter of 2027, which will add a direct cost for carriers running through the state.
Each of these regulatory changes affects a different part of the country and the driver and carrier pipeline of qualification, onboarding, licensing eligibility, or classification which impacts capacity availability. These indicators all point generally in the same direction that less available capacity than would otherwise exist given current demand. Hence the capacity reporting in the LMI which advised, “Transportation Capacity continues to compress (-0.9) at 30.8, which may be a factor in the continued upward swing (+5.2) of Transportation Utilization at 74.7” (Logistics Managers’ Index, 2026).
Dollar and the Trade Balance
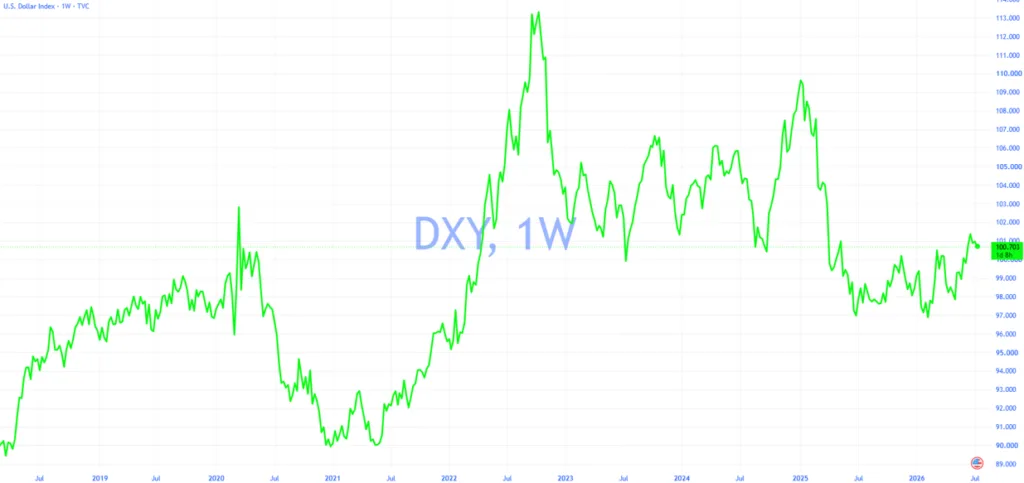
The U.S. Dollar Index (DXY) has moved back above 100 after earlier declines. At the same time, ISM’s June report shows imports expanding at 52.9 while exports are contracting at 48.5 (ISM, 2026). A stronger dollar makes U.S. exports comparatively more expensive for foreign buyers and imports comparatively cheaper for U.S. buyers, which is consistent with imports expanding while exports contract. That combination tends to widen the trade deficit, and for domestic freight markets, more imports mean more inbound container and drayage volume at ports, which reinforces demand on the truck capacity that is already constrained.
Practical Business Implications for Shippers
For shippers and procurement teams, the current data suggests several practical takeaways:
- Budget for continued rate pressure, not a near-term reversal. With capacity constrained by regulation as much as by market forces, transportation rate relief is unlikely to arrive anytime soon without a noticeable increase in capacity availability or a decrease in demand.
- Reassess mode mix where service requirements allow it. Rail’s 0.7% year-over-year PPI increase compares favorably to truck’s 16.0%, and rail container volume is already growing, suggesting real substitution is happening in the market. At the same time, intermodal container volumes continue to grow, suggesting that many shippers are actively shifting freight from over-the-road (OTR) trucking to rail where transit times and service requirements allow. At TLI, we’ve experienced a noticeable increase in customer demand for intermodal solutions. If you’re evaluating ways to reduce transportation costs, our team would be happy to perform a complimentary lane-by-lane analysis comparing current intermodal rates against your existing OTR pricing. Contact us today to determine whether rail can provide meaningful savings for your network.
- Watch diesel independently of oil headlines. Because diesel lags crude and moves more slowly, do not assume a drop in oil prices will show up quickly in fuel surcharges.
- Track regulatory timelines closely. The non-domiciled CDL rule, EPA NOx amendments, and independent contractor rulemaking each have distinct compliance timelines that will affect available capacity on a rolling basis through 2026 and into 2027.
- Expect elevated inventory carrying costs. The LMI’s inventory and warehousing data suggests shippers are finally building buffer stock, which raises warehousing costs even as it may reduce exposure to further transportation rate increases.
The freight market’s current rate environment is not the product of a single cause. Manufacturing demand is expanding, inventories are being rebuilt, and imports are growing against a stronger dollar, all of which support freight volume indicating an increase in demand. At the same time, a series of federal regulatory actions is tightening the available pool of qualified drivers and carriers faster than the market can otherwise adjust. Diesel remains elevated and slow to respond to broader energy price swings. Until either demand growth slows meaningfully or new capacity enters the market, truckload rates are likely to remain elevated across spot and contract channels alike. It is critical to evaluate your budgets meaningfully.
Frequently Asked Questions
Rates are elevated because freight demand, driven by manufacturing growth and inventory rebuilding, is rising at the same time several federal regulations are reducing the available supply of qualified drivers and carriers.
Diesel tends to move more slowly than crude oil and does not track its daily volatility. Prices are currently elevated at $4.796 per gallon and have not shown signs of a meaningful near-term decline.
Spot rates are up 31.29% year-over-year and contract rates are up 9%, according to the U.S. Bank Freight Payment Index (Fitzgerald, 2026).
Key changes include new Drug and Alcohol Clearinghouse ID verification requirements, non-domiciled CDL eligibility, reinforced English-language proficiency enforcement, a proposed EPA NOx rule, and a new DOL independent contractor rulemaking.
For some lanes, yes. Rail’s producer price increase (0.7% year-over-year) is far below truck’s (16.0%), and weekly rail container volume is already up roughly 6%, suggesting shippers are shifting volume where service requirements permit it.
References & Citations:
California Department of Motor Vehicles. (2026). Federal government requires California DMV to cancel certain non-domiciled drivers’ licenses. https://www.dmv.ca.gov/portal/news-and-media/federal-government-requires-california-dmv-to-cancel-certain-nondomiciled-drivers-licenses/
DAT Freight & Analytics. (2026). DAT Trendlines. https://www.dat.com/trendlines
Federal Motor Carrier Safety Administration. (2026). Non-domiciled CDL 2026 final rule FAQs. U.S. Department of Transportation. https://www.fmcsa.dot.gov/regulations/non-domiciled-cdl-2026-final-rule-faqs
Fitzgerald, C. (2026). U.S. Bank: Truck freight rates rose considerably in April and May. The SCX Change. https://www.thescxchange.com/move/u-s-bank-truck-freight-rates-rose-considerably-in-april-and-may
FleetOwner. (2026, May). This week in trucking: New vocational trucks, legal decisions [Podcast]. https://www.fleetowner.com/news/podcast/55362125/this-week-in-trucking-new-vocational-trucks-legal-decisions
FleetOwner. (2026, June). This week in trucking: Goodbye diesel exhaust fluid derates, hello truck parking funding [Podcast]. https://www.fleetowner.com/news/podcast/55389895/podcast-this-week-in-trucking-goodbye-diesel-exhaust-fluid-derates-hello-truck-parking-funding
Institute for Supply Management. (2026, June). Manufacturing ISM Report on Business. https://www.ismworld.org/globalassets/pub/research-and-surveys/rob/pmi/hotdm202606pmi.pdf
Landline Media. (2026). Motus problems persist; FMCSA gives guidance. https://landline.media/motus-problems-persist-fmcsa-gives-guidance/
Logistics Managers’ Index. (2026, June). June 2026 Logistics Managers’ Index report. https://www.the-lmi.com/june-2026-logistics-managers-index.html
The Trucker. (2026). FMCSA adds new ID requirements for drug and alcohol clearinghouse online database. https://www.thetrucker.com/trucking-news/truck-driving-jobs-news/fmcsa-adds-new-id-requirements-for-drug-and-alcohol-clearinghouse-online-database
U.S. Bureau of Labor Statistics. (2026, June). Consumer Price Index news release. U.S. Department of Labor. https://www.bls.gov/news.release/cpi.nr0.htm
U.S. Bureau of Labor Statistics. (2026). Consumer Price Index by category [Chart]. U.S. Department of Labor. https://www.bls.gov/charts/consumer-price-index/consumer-price-index-by-category.htm
U.S. Bureau of Transportation Statistics. (2026, June). Transportation Producer Price Index, June 2026. U.S. Department of Transportation. https://www.bts.gov/newsroom/transportation-producer-price-index-june-2026
U.S. Department of Labor. (2026, May 14). US Department of Labor reinforces English language proficiency requirements for foreign workers operating commercial motor vehicles. https://www.dol.gov/newsroom/releases/eta/eta20260514-0
U.S. Energy Information Administration. (2026). Gasoline and diesel fuel update. U.S. Department of Energy. https://www.eia.gov/petroleum/gasdiesel/